Week 1: Living and Learning in a Digital World
Part of doing and thinking about digital history involves first understanding and thinking about digital citizenship, identity, and work. Digital technologies are the “water” we swim in today, but we often don’t pause to consider how best to live and learn in that context.
In this week, we will explore:
- Introduction & basics of digital technology
- Challenges of learning in a digital environment
- Tools to enable better learning
- Establishing your own digital space for creating and showcasing your work
Tuesday, January 16
Topics
- What is digital history? What is this class?
- Survey
- Review of policies, grading, assignments
- Discussion about digital work, learning and growth
- Hypothesis & WordPress setup. Hypothesis extension is HERE
Reading (complete by Tuesday, January 23)
- Sheila Brennan. “Digital History” The Inclusive Historians’ Handbook (blog).
- “History of Computers – from the Abacus to the iPhone.” Explain That Stuff.
- Video: “How the Internet Works”
- Ryan J. Pelton “How Is Your Consumption Versus Creator Ratio?”
Tools
Essential tools/steps to take when doing digital work. Mostly recommendations, except the password manager, which is required.
- “Turn Off Your Push Notifications. All of Them.” Wired (reading)
- “It’s Time to Ditch Chrome” Wired UK
- Use a Password Manager
- Reader View – strips away clutter like ads, background images, videos, and changes the page’s text size, contrast and layout for better readability
- Leechblock – extension for Firefox and Chrome lets you specify which sites to block, when, and for how long.
Assignments (complete by Monday, January 22)
- Install password manager (Bitwarden recommended)
- Install Hypothesis extension/bookmarklet on your usual browser, and login with the account created on our first day.
- Add at least 3 Hypothesis annotations to each of the readings by Brennan and Pelton listed above. Don’t forget to post your annotations in our class group (“Digital History SRU SP24”). Remember that an annotation can include a question, a discussion of a point made by an author, a link to more info, or a reply to another student’s annotation. This week will just be a “practice run” but see Annotation Assignment page for how they will be assessed during the semester.
Thursday, January 18
NO CLASS MEETING
Week 2: Origins and Evolution of Digital History (January 23)
Tuesday, January 23
Exploring and customizing WordPress
During this class session, we’ll get you set up with WordPress, and review:
- basics of page and blog post publishing
- adding themes and design elements to your WordPress site
- function of plugins, and how and why you might make use of them
Thursday, January 25
The History of #DH
In this unit, we will explore:
- the origins and evolution of historians’ usage of digital technology
- the specific methods historians tend to use
- “digital history” as a subfield within the larger practice of digital humanities
Reading
- Vannevar Bush, “As We May Think.” The Atlantic, July 1945.
- “The Promises and Perils of Digital History” in Cohen, Daniel J., and Roy. Rosenzweig. Digital History: A Guide to Gathering, Preserving, and Presenting the Past on the Web. Philadelphia: University of Pennsylvania Press, 2006.
- Amanda Visconti, “Digital Humanities: What, Why, & How”
- Seth Denbo, “On Being a Historian Today: The Importance of Digital Literacy ” American Historical Association Perspectives blog
Assignments (due Monday 1/29)
- Share your WordPress URL with me (ASAP)
- Learning Reflection: Write a short (150-250 words) blog post reflecting on what you’ve learned thus far in our class, and any skills you think you have developed. If you wish, you may also add a discussion of any concerns or anxieties you have about the material so far.
- Annotate Week 3 readings with Hypothesis
Week 3: Surveying the #DH Landscape (January 30)
What Are Different Ways of “Doing” Digital History?
As we’ve come to see thus far, digital history/humanities is a broad field that can encompass a lot of different types of historical research and interpretation. So, it’s time to try and develop some concrete ways of classifying and describing digital history projects. In this unit, we will explore:
- a taxonomy of digital history projects
- criteria for assessing quality and effectiveness of digital project
- practice in “reading” DH projects
Reading*
- Jeff McClurken, “Digital History Reviews” Organization of American Historians/Journal of American History
- National Council on Public History (NCPH) “Digital Project Review Guidelines” The Public Historian
*don’t forget to annotate in our class group with Hypothesis
In-class work: Digital History Reviews (You may visit any of these ahead of time; I will assign you a site to review in class)
- Plateau Peoples’ Project, http://plateauportal.wsulibs.wsu.edu/
- Photogrammar, http://photogrammar.yale.edu/
- Cleveland Historical, http://clevelandhistorical.org
- Baltimore Uprising 2015, http://baltimoreuprising2015.org/
- The Spread of US Slavery, 1790-1860, http://lincolnmullen.com/projects/slavery/
- Remembering Lincoln, http://rememberinglincoln.fords.org/
- Journal of the Plague Year COVID-19 Archive, https://covid-19archive.org/s/archive/page/welcome
- Slave Voyages, https://www.slavevoyages.org/
- Old Fulton NY Postcards http://fultonhistory.com/
- New York Public Library Digital Research Projects, https://www.nypl.org/digital-research/projects
- Historic Pittsburgh, https://historicpittsburgh.org/
- The Well-Read President https://definingteddy.wordpress.com/the-well-read-president/
- Electing the House of Representatives https://dsl.richmond.edu/panorama/congress/
- The American Yawp, http://www.americanyawp.com/
- Wearing Gay History, https://wearinggayhistory.com/
- Mapping Inequality, https://dsl.richmond.edu/panorama/redlining/
- Valley of the Shadow, https://valley.newamericanhistory.org/
- Mapping Historical New York, https://mappinghny.com/
- Surviving History: The Fever!, http://theappendix.net/special/the-fever/
- The Roaring ‘Twenties, http://nycitynoise.com/
- Mapping Occupation, http://mappingoccupation.org/
- Encyclopedia of Philadelphia, http://philadelphiaencyclopedia.org/
- Visualizing the Red Summer, https://visualizingtheredsummer.com/
- What Middletown Read, https://lib.bsu.edu/wmr/
- Small Town Noir, https://smalltownnoir.com/
Thursday, February 1
- WordPress refinement/cleanup
- Formal review practice & assignment review
Homework (due Monday, February 5)
- Complete the Digital History project review assignment
- Complete & annotate Week 4 Readings
Week 4: Basics of Web Publishing (February 6)
Thus far in the class we’ve gotten a sense of the scope of digital history, and the possibilities and methods used by historians.
In this week, we’ll shift briefly to exploring some of the basics of web publishing, consider the importance of design in digital history/humanities, and practice writing some basic HTML and CSS.
Learning Outcomes
- understand the value of design in DH (and web publishing more generally)
- understand the role of HTML and CSS languages in web publishing
- gain basic proficiency in editing HTML/CSS to alter web-published documents
Readings (for Tuesday)
- Heppler, Jason A. “How To: Designing Digital History” Jason Heppler Weblog, 31:05 – CST 600. https://jasonheppler.org.
- Giorgio Ruggeri, “Digital History Is [Also] a Matter of Design,” Medium (blog), January 31, 2018
Tuesday
In class, we will work through the a series of tutorials from the Mozilla Foundation to learn the basics of HTML and CSS. You may start these before class, or wait until our meeting
Thursday
Continue work on the Mozilla Foundation tutorials. You need complete only these:
- Introduction to HTML
- Getting started with HTML
- What’s in the head? Metadata in HTML (you can skim – not skip – this section)
- HTML text fundamentals
- Creating hyperlinks
- Under the “Multimedia and embedding” module
- All modules in CSS first steps overview.
Homework (due Tuesday, February 13)
- Complete the HTML and CSS modules linked above
- Write a brief (250-word) blog post about your experience learning the basics of web publishing languages. Did you find understanding the concepts challenging? What did it help you understand about websites, structure, and design? Did it increase your interest in learning more about coding? (Note that “no” is a perfectly fine answer!)
- Complete & annotate Week 5 Readings
Week 5: Telling Stories with Historical Data (February 13)
Thus far in the class we’ve gotten a sense of the scope of digital history, and the possibilities and methods. In this week we’ll begin exploring the use of historical data, which forms the basis of almost every form of digital storytelling.
Topics for this week:
- the purposes and rationale behind data visualization
- various methods of communicating historical data in visual forms

Readings
Remember to annotate with Hypothesis in our Digital History SP2024 group!
- Gibbs, Frederick W. “New Forms of History: Critiquing Data and Its Representations.”The American Historian, 2016.
- Thompson, Clive. “The Surprising History of the Infographic.” Smithsonian Magazine.
- Hands-On Data Visualization, “Audience and Overview” & “Introduction”*** (Note that the “Introduction” chapter consists of several short sub-sections; be sure to read them all)
Additional Resources
These do not need to be annotated with Hypothesis, but are pretty cool and should be reviewed. They will come in most handy when you start working with data.
- “A Periodic Table of Visualization Methods” Visual Literacy
- Reddit: Data is Beautiful
- Types of Data Visualizations and Functions, Data Viz Project
- Data Visualization: Basic Principles
Thursday
Asking questions about data:
Butler County Poor Farm records
Digital tools for historical research
Week 6: Exploring and Working with Data (February 20)
Tuesday, February 20

Readings/Tasks
(NOTE: NO Hypothesis annotations for this week)
Read the two chapters from Hands On Data Visualization, and complete the tutorials that are part of those chapters. DO NOT skip this; you will be expected to have practiced these basic skills by our class on Thursday.
- Chapter 1 & 6 from Hands-On Data Visualization (NOTE: you may omit the third section of Chapter 6 on Tableau Public).
- Spencer Roberts, “Historians’ Spreadsheet”
- Create Google and Datawrapper accounts
Sample Data for Experimenting with these Tools
(Note: these are set to “View Only” – click File, then “Make a Copy” before you begin.)
Thursday, February 22
Refining Data for Better Visualizations with Pivot Tables
Today we’ll learn how to use pivot tables to better analyze large sets of data by focusing in on specific values.
Reference: Hands on Dataviz, Summarize Data with Pivot Tables
Practicum use data (Note: these are set to “View Only” – click File, then “Make a Copy” before you begin.)
In-Class Practicum
Exercise #1
Using the 1915 Butler County Poor Farm data,
- create a pivot table that counts residents by some variable
- try adding another variable (for example, how many women are widowed? how many laborers are born in Austria?)
Exercise #2

Using the US Presidential Cabinet data above,
- create a pivot table in Google Sheets that shows Cabinet members who served in the military by branch (ie, how many served in the Navy, how many in the Army, etc.).
NOTE: when you do this, you will come up with some messy data (as pictured at right). How could you use the Find & Replace command to clean this up? Give it a shot! - create a pivot table in Google Sheets that shows the number of cabinet departments (note: not total number of appointments) under each president in the 20th century only. This one is a bit more challenging (hint: use “CountUnique” and the Filter tool)
- use this data to create a visualization in Datawrapper (just copy and paste your pivot table data)
Week 6 Homework (due Monday, February 26)
- Write a 400-500-word blog post summarizing what you have learned about principles of data visualization, and the skills you are developing with regards to data visualization and analysis.
- Embed at least two visualizations you have created with either the sample data here, or another dataset.
Week 7: Are You Tired of Data Yet? (February 27)

Tuesday, February 27
In Class
Review Historical Data Visualization final project
Readings
Working with data is lovely when it’s prepared for us in handy CSV files, all nice and tidy. But, sadly, much historical data remains trapped in paper copies or scanned PDFs. This week we’ll explore how to extract and clean data that you might encounter during your research.
- Tabula, a tool for extracting data from PDFs (if you’re on a Chromebook, a Chrome extension called Tabello seems to accomplish the same task)
- The instructions for using Tabula to extract data can be found in Chapter 4 of Hands-On Data Visualization
Sample PDFs for In-Class Practice
Thursday, February 29
Data Visualization and Text
Today we’ll look at some simple methods of textual analysis using a few web-based tools. While intensive textual analysis usually requires learning some coding, these tools can provide an accessible way to explore what computational analysis can tell us about texts.
Examples of Textual Analysis
- Gender and RateMyProfessor reviews (made using Bookworm)
- America’s Public Bible – Biblical quotations as they appeared in 19th-century newspapers
Sample Texts for In-Class Practice with Voyant/Lexos
- Seneca, Letters from a Stoic
- Jules Verne, Around the World in Eighty Days
- Diary of Samuel Pepys
- Frederick Douglass, Narrative of the Life of Frederick Douglass
- The Papers and Writings of Abraham Lincoln
Write a 500ish word blog post to the following questions:
What questions can I explore with this dataset?
What questions do I want to explore, but are impossible with this data?
Is it possible to obtain the missing data I describe in question two? If so, how can I do it?
What kinds of manipulation will this dataset require? Am I (will I be) capable of doing this myself, or will I need help?
You should also create a few sketch-like data visualizations. These can be literal sketches on paper, with photos of the drawings posted in your blog. These are not final or authoritative! They’re a way to start thinking about what data have, and what kinds of questions you can ask about it.
Week 9: Mapping and Geospatial Data (Marcb 18)

Tuesday, March 19
Today we’ll put our data visualization skills to the test by completing a Data Skills Challenge!
Instructions
- Here’s a PDF of a page from Thomas Sugrue’s book The Origins of the Urban Crisis: Race and Inequality in Postwar Detroit.
- Your challenge: create an accurate and readable visualization of this data
A few hints:
- remember that Tabula or Tabello (Chrome extension) could be useful here.
- years in this table are in a row; that’s great for tables, but not always for databases. You might need to use the TRANSPOSE function
- The three variables measured here have very different ranges (note that the last two are in hundreds of thousands); how could you accommodate that on a single chart?
Thursday, March 21
What can digital mapping tell us about the past?
Outcomes
By the end of this unit, you’ll be able to:
- Understand maps as a method for displaying data
- Make educated guesses about what kinds of computer data went in to producing a digital map
- Understand special features found in geospatial data for historical study
- Explain why we need to be careful about the view of the world that is presented in a map and in a data set
Reading
Remember to annotate these in our class Hypothesis group
- Richard White, “What is Spatial History?”
- Knowles, Anne Kelly. “A More Humane Approach to Digital Scholarship.” Parameters, August 2016. See also: Knowles, Anne. “A Cutting-Edge Second Look at the Battle of Gettysburg.” ESRI Storymaps
- Hillier, Amy. “Invitation to Mapping: How GIS Can Facilitate New Discovering in Urban and Planning History.” Journal of Planning History 9, no. 2 (2010)
Recommended (not required)
- “DH GIS Projects,” https://anterotesis.com/wordpress/mapping-resources/dh-gis-projects/ – pretty extensive list of map-based DH projects – some occasionally dormant; poke around and see what strikes your interest.
Homework (due Monday, March 25)
Write a 400-500-word blog post summarizing progress on your final project. At a minimum, you should include these three elements:
- what dataset are you using? (if possible, please provide a link to the data)
- what are your current research questions that you’re hoping to answer with this data?
- how can I help you move forward? what challenges concern you? (this might be technical details, or more theoretical issues)
Week 10: Data Map Creation (March 25)
Today we’ll learn how to create basic data maps using Datawrapper
Datasets for in-class use:
For mapping your specific dataset, see Chapter 7 – Map Your Data in Hands-On Data Visualization
Don’t forget the importance of Choosing the Right Map for your data
Georectification Practicum
Today we’ll learn the principles of “georectification” which sounds like an uncomfortable medical procedure, but is actually a useful tool for linking historical maps to present-day GIS data.
Georectification involves matching control points to align the map image with an existing coordinate system. MapWarper is a tool that allows you to georectify historical maps After plotting corresponding points, the tool warps the historical map (using an algorithm) so that it lines up with the contemporary OpenStreetMap.
- Open Map Warper (you’ll need to create a new account if you did not do so on Tuesday)
- Download either Pittsburgh 1872 map or this Slippery Rock 1925 Sanborn map
- In the MapWarper window, click to “Upload Map.” Enter the required metadata, upload the image, and click to “Create.”
- Click the “Rectify” tab. In the side-by-side interface, you can navigate between each map using the mapping tools on the left.
- Navigation: Click the white triangles to move up/down/left/right.
- Zoom: Click the plus or negative signs to zoom in or out one step. Move the blue slider button to move multiple steps at once. (Note: you may also use your mouse/trackpad to pan and zoom).
- Locate shared points on each map. Use the controls at the top right to add and modify Control Points on each map. (Note: You should add at least three points to rectify. Focus on locating points across the map- not in one single area. The more points, the better the rectification will be.)
Week 11: Project Workshops (April 1)
This week we will not meet for class, but you should use this freed-up time to make progress on your final projects.
Schedule a time to meet with me and bring
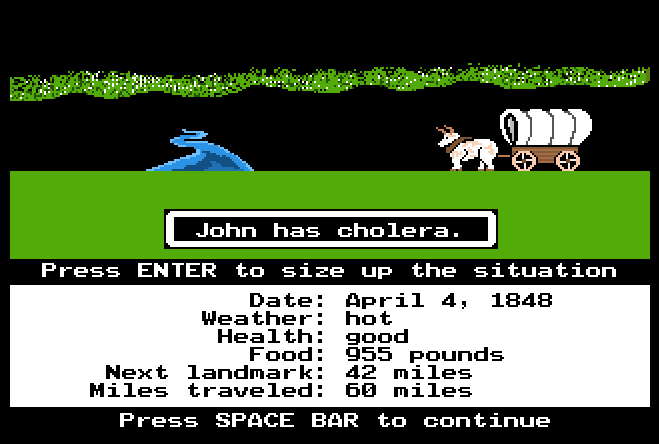
Week 12: Playing the Past (April 8)
In this unit we will explore:
- the potential of video games for engaging with the past
- challenges and potential problems with gaming as a mode of engagement
Tuesday, April 9
Reading
It’s been a few weeks since we’ve had readings, so don’t forget to annotate with Hypothesis!
- Jeremiah McCall “Playing with the Past: History and Video Games (and Why It Might Matter),” Journal of Geek Studies 6(1): 29-48 (2019)
- Trevor Owens, “Games as Historical Scholarship.” Play the Past blog
- Denning, Andrew. “Deep Play? Video Games and the Historical Imaginary.” The American Historical Review 126, no. 1 (March 1, 2021): 180–98.
Thursday, April 11
Let’s play!
Below are a few online games dealing with historical topics. Play at least two, and write a 250-word blog post addressing these questions:
- did the experience of “playing the past” add anything to your understanding of the historical topic?
- could you envision improvements that would have enhanced the experience? (focus here on content or gaming elements, rather than “the graphics weren’t good” or something)
- what are the advantages of this kind of engagement with the past?
- does the medium of gaming risk trivializing history? why or why not?
Note: I am well aware that several of these games are very old and/or not especially sophisticated – but they are free and relatively easy to learn for non-gamers!.
- Mission US
- Oregon Trail Deluxe
- Surviving History: The Fever
- When Rivers Were Trails (must be downloaded & installed, but is free, and pretty cool)
Week 13: The Perils of Public Digital History (April 15)
In this unit, we will explore:
- the definition of “public history” and its goals, methods, and relationship to the academic field
- how digital platforms provide new methods for engaging broad non-academic audiences
- the potential challenges and limitations of using digital tools for public historical engagement
Blog Post Prompts
Address one of these questions in a post of approximately 500 words, using specific examples from the reading.
- Why should we be cautious about viewing digital technology as the ultimate tool for public engagement?
- Is the Internet bad for history?
- What “lessons” do these readings provide for doing digital history?
Reading
- “About the Field: How Do We Define Public History?” National Council on Public History.
- Hurley, Andrew. “Chasing the Frontiers of Digital Technology.” The Public Historian 38, no. 1 (February 1, 2016): 69–88.
- also visit the St. Lous Virtual City Project and experiment with the browser-based viewing of Old North St. Louis
- Leslie Madsen-Brooks, “I Nevertheless Am a Historian”: Digital Historical Practice and Malpractice around Black Confederate Soldiers” in Dougherty, Kristen Nawrotzki; Jack. Writing History in the Digital Age, 2013.
Week 14: Final Project Presentations
Tuesday, April 23
No class meeting – I am available for consultation as you work to finalize your projects.
Thursday, April 25
In-class presentations of final projects! Be prepared to discuss:
- the historical dataset you used for the project
- what research questions you tried to answer with the dataset
- methodological choices re: visualization and analysis
- challenges or limitations you encountered.
